Free: 3 months of data free. Premium: Longer timeframes, improved filtering tools, no ads.
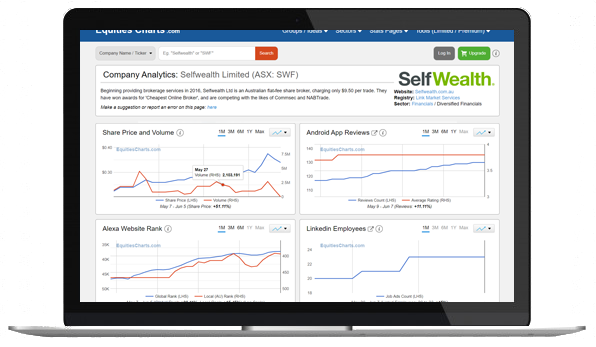
EquitiesCharts.com - Unique Data for Unique Insights
Find insights you hadn't even imagined.
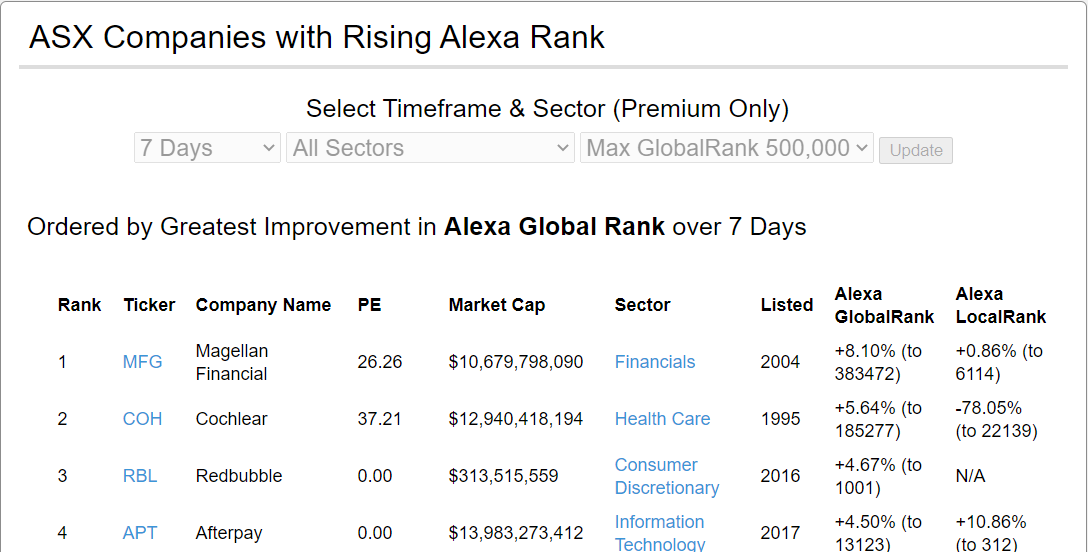
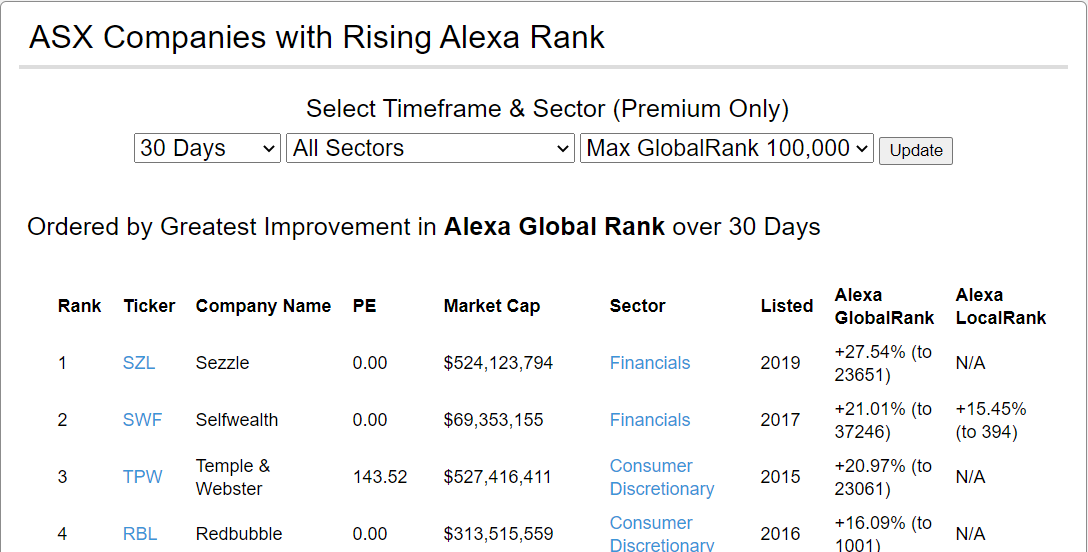
Change in Website Popularity
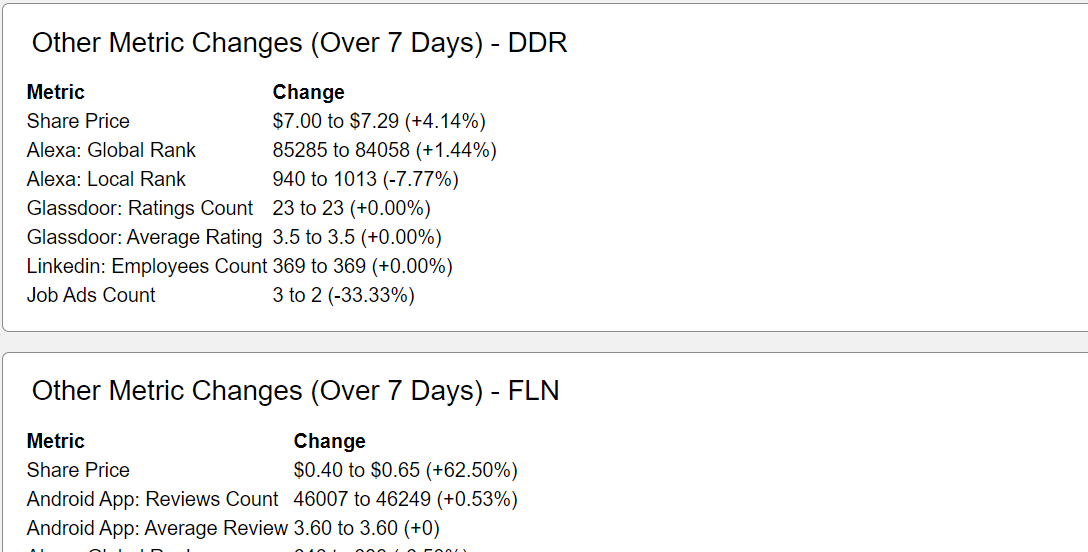
App Usage Trends and Average Reviews
Change in Employee Numbers
Change in Job Ads Volume
Change in Brand Search Frequency
Website Subdomains
Search Companies by Announcement Keywords
And more...
Search for a company at the top to get started, or browse through our categories to get ideas.
Free vs Premium
We try to give free users access to every tool, though premium users get increased functionality, like longer timeframes or additional filtering options.
Free
Premium
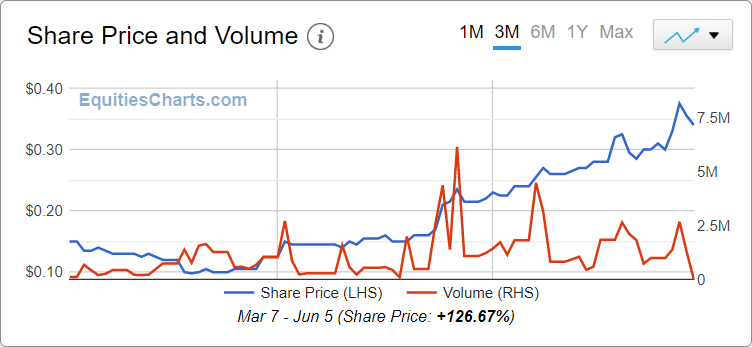
Chart Timeframes: Up to 3 Months
Can provide some recent conclusions - changes in trend.
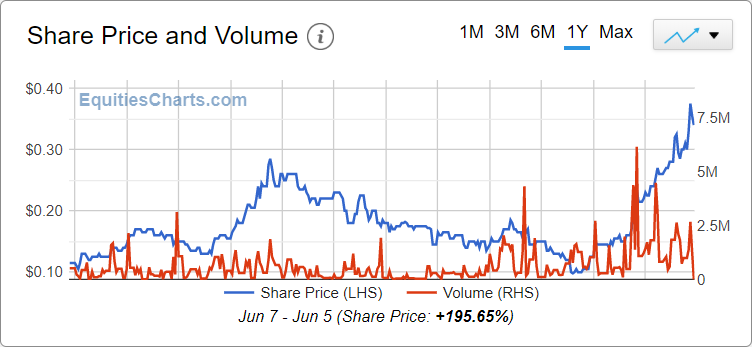
Chart Timeframes: Unlimited
Can provide additional/clearer conclusions, and longer term context.
Premium Tools and Ideas: Default Filter Settings Only
Can provide some short term conclusions - changes in trend.
Premium Tools and Ideas: Extra Timeframes and Filtering Options
Can provide additional/clearer conclusions.
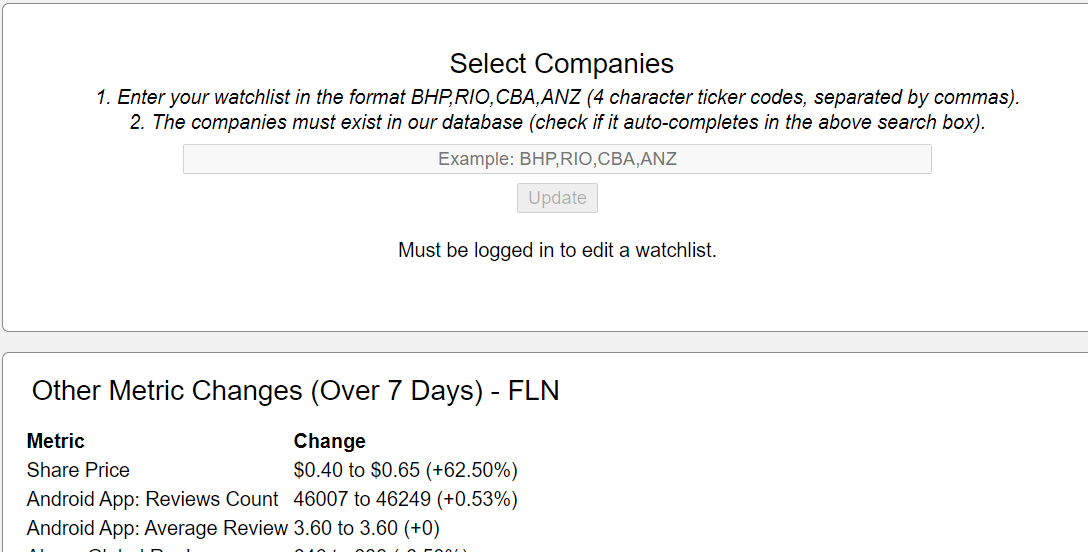
Watchlist: Example Watchlist Only
See how the example watchlist looks.
Watchlist: Select Your Own Companies
Quick links to your company panels, recent combined announcements, recent combined dividends, and quick summary of metric changes for your companies.
Disclaimer: Our main goal is to provide you with interesting and insightful charts and metrics. Our primary goal is not data reliability, and you should assume that the data is not 100% complete or accurate. Eg. our caching system could make some data hours or days outdated, or we could run into data collection issues. This website should be used as a tool to get you thinking about a company in new ways. It should not be used to make direct investment decisions, but to help you come up with ideas which you then confirm with primary data sources. We are not liable for any data errors, omissions, delays or interuptions, or any loss arising from its use, nor do we offer financial advice.